
 930 お客様のコメント
質問 1:
A user needs to share an important segment with a group of users in a Product Profile Group. Why can't a member of his Product Profile Group view the segment?
A. The user forgot to curate the Segment.
B. The user only selected "Make this segment public-.
C. The user forgot to select "Make this segment public".
正解:C
解説: (Pass4Test メンバーにのみ表示されます)
質問 2:
A data analyst wants to create a segment of traffic that started on the page "Facebook App Home" and accessed the "Home Page" in Analysis Workspace.
Based on the project presented below:
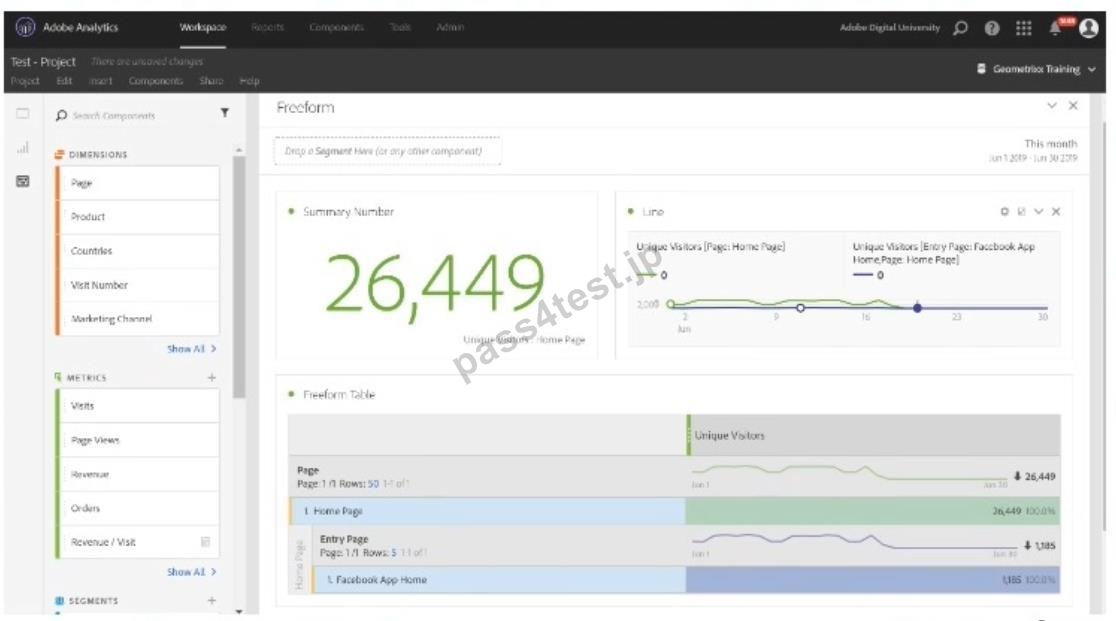
What is the proper way to create this segment and continue working on the project without loss of data?
A. Click on the Main Menu Components, then on segments, and create a new segment of a VISITOR container with entry page equals "Facebook App Home" AND page equals "Home Page".
B. Click on the Internal Menu of the Components project, then on New Segment, and create a segment of a VISIT container with entry page equals "Facebook App Home" AND page equals "Home Page".
C. Click and select "Home Page" and "Facebook App Home" in the table. Then right click on the selection and choose to Create a Segment from Selection, and save the segment with the exact configuration that has been automatically defined.
正解:B
解説: (Pass4Test メンバーにのみ表示されます)
質問 3:
The conversion percentage from one step to another in a Fallout Visualization is 104%. What could be the reason the percentage is over 100%?
A. The success event can be fired outside of the specified funnel order.
B. Another report suite's data is polluting the funnel.
C. Success events cannot be added to a funnel.
正解:A
解説: (Pass4Test メンバーにのみ表示されます)
質問 4:
A chart displaying the daily trend of Orders and their performance against the daily average for the last month is needed.
How can this requirement be met?
A. Use a Line Visualization to trend the Orders and the daily average as a Calculated Metric in the same chart.
B. Use a Bullet Visualization to trend the Orders and Day dimension in the same chart.
C. Use a Histogram Visualization to trend the Orders and enable the settings to show the trend against the average value.
正解:A
解説: (Pass4Test メンバーにのみ表示されます)
質問 5:
Analyzing the data in the image below, a data analyst verifies that the report of "entries" per page, shows that the "HomePage A" page is responsible for only 3.4% of the total "entries" to the site:

When comparing this information with the Occurrences per Entry Pages report below, it verifies that the
"Homepage A" page has 4.5% of the total Occurrences of the Entry Pages:
Based on both the images and knowledge on the standard metrics of Adobe Analytics, which statement is correct?
A. The Entries metric refers to entries on a given page, and is counted every time the page loads on a visit.
B. Occurrences refers to all hits associated with a particular entry page, also counting events triggered throughout the session.
C. The Entry Page Dimension refers exclusively to the first page that a visitor lands on the site on every visit, so there are distortions regarding the period of analysis.
正解:B
解説: (Pass4Test メンバーにのみ表示されます)
A user needs to share an important segment with a group of users in a Product Profile Group. Why can't a member of his Product Profile Group view the segment?
A. The user forgot to curate the Segment.
B. The user only selected "Make this segment public-.
C. The user forgot to select "Make this segment public".
正解:C
解説: (Pass4Test メンバーにのみ表示されます)
質問 2:
A data analyst wants to create a segment of traffic that started on the page "Facebook App Home" and accessed the "Home Page" in Analysis Workspace.
Based on the project presented below:
What is the proper way to create this segment and continue working on the project without loss of data?
A. Click on the Main Menu Components, then on segments, and create a new segment of a VISITOR container with entry page equals "Facebook App Home" AND page equals "Home Page".
B. Click on the Internal Menu of the Components project, then on New Segment, and create a segment of a VISIT container with entry page equals "Facebook App Home" AND page equals "Home Page".
C. Click and select "Home Page" and "Facebook App Home" in the table. Then right click on the selection and choose to Create a Segment from Selection, and save the segment with the exact configuration that has been automatically defined.
正解:B
解説: (Pass4Test メンバーにのみ表示されます)
質問 3:
The conversion percentage from one step to another in a Fallout Visualization is 104%. What could be the reason the percentage is over 100%?
A. The success event can be fired outside of the specified funnel order.
B. Another report suite's data is polluting the funnel.
C. Success events cannot be added to a funnel.
正解:A
解説: (Pass4Test メンバーにのみ表示されます)
質問 4:
A chart displaying the daily trend of Orders and their performance against the daily average for the last month is needed.
How can this requirement be met?
A. Use a Line Visualization to trend the Orders and the daily average as a Calculated Metric in the same chart.
B. Use a Bullet Visualization to trend the Orders and Day dimension in the same chart.
C. Use a Histogram Visualization to trend the Orders and enable the settings to show the trend against the average value.
正解:A
解説: (Pass4Test メンバーにのみ表示されます)
質問 5:
Analyzing the data in the image below, a data analyst verifies that the report of "entries" per page, shows that the "HomePage A" page is responsible for only 3.4% of the total "entries" to the site:
When comparing this information with the Occurrences per Entry Pages report below, it verifies that the
"Homepage A" page has 4.5% of the total Occurrences of the Entry Pages:
Based on both the images and knowledge on the standard metrics of Adobe Analytics, which statement is correct?
A. The Entries metric refers to entries on a given page, and is counted every time the page loads on a visit.
B. Occurrences refers to all hits associated with a particular entry page, also counting events triggered throughout the session.
C. The Entry Page Dimension refers exclusively to the first page that a visitor lands on the site on every visit, so there are distortions regarding the period of analysis.
正解:B
解説: (Pass4Test メンバーにのみ表示されます)


Yamazaki -
Pass4Testの問題集を購入して合格するのはこれで三回目になります。いつも感謝してます。