
 クリック」
クリック」
質問 1:
What type of graph would you use to see the distribution of a scale variable?
A. Bar chart
B. Scatter plot
C. Pie chart
D. Histogram
正解:D
質問 2:
When you read data stored in an Excel file via File ... Open ... Data, you may need to specify which options? (Choose three.)
A. Read a Range of cells
B. Read variable names from the first row of data
C. Specify the Worksheet to read/import
D. Number of Worksheets to read/import
正解:A,B,C
質問 3:
What does the Customized Variable View button in the Options dialog allow a user to specify? (Choose three.)
A. The display order of the attributes
B. The size of the Variable View window
C. The attributes that are displayed
D. The default setting of the Variable View display
正解:A,C,D
質問 4:
Using the Compute Variable dialog below, the target variable HighSchool will have the following values. (Choose two.)
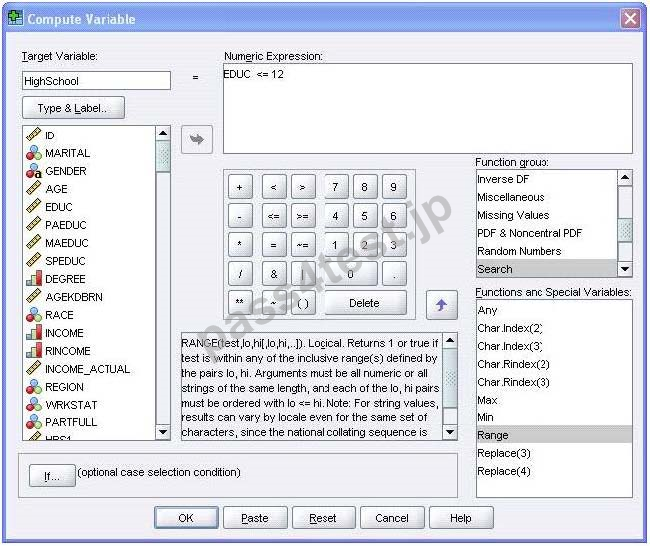
A. Value 0 if EDUC is greater than 12
B. System-missing value if EDUC is greater than 12
C. Value 1 if EDUC is less than or equal to 12
D. The same value as EDUC if EDUC is less than or equal to 12
正解:B,C
質問 5:
Which interpretation is correct for this Regression Coefficients table?

A. For every additional year that you get older, your beginning salary increases on average by $13.
B. For every additional year that you get older, your beginning salary increases on average by $35.9.
C. For every additional year that you get older, your beginning salary decreases on average by $35.9.
D. For every additional year that you get older, your beginning salary decreases on average by $13.
正解:B
What type of graph would you use to see the distribution of a scale variable?
A. Bar chart
B. Scatter plot
C. Pie chart
D. Histogram
正解:D
質問 2:
When you read data stored in an Excel file via File ... Open ... Data, you may need to specify which options? (Choose three.)
A. Read a Range of cells
B. Read variable names from the first row of data
C. Specify the Worksheet to read/import
D. Number of Worksheets to read/import
正解:A,B,C
質問 3:
What does the Customized Variable View button in the Options dialog allow a user to specify? (Choose three.)
A. The display order of the attributes
B. The size of the Variable View window
C. The attributes that are displayed
D. The default setting of the Variable View display
正解:A,C,D
質問 4:
Using the Compute Variable dialog below, the target variable HighSchool will have the following values. (Choose two.)
A. Value 0 if EDUC is greater than 12
B. System-missing value if EDUC is greater than 12
C. Value 1 if EDUC is less than or equal to 12
D. The same value as EDUC if EDUC is less than or equal to 12
正解:B,C
質問 5:
Which interpretation is correct for this Regression Coefficients table?
A. For every additional year that you get older, your beginning salary increases on average by $13.
B. For every additional year that you get older, your beginning salary increases on average by $35.9.
C. For every additional year that you get older, your beginning salary decreases on average by $35.9.
D. For every additional year that you get older, your beginning salary decreases on average by $13.
正解:B


 0 お客様のコメント